URETEK Vietnam assessed subsurface conditions around an underground wastewater and drainage network that had been in service for approximately 13 years. The survey covered five operational areas and helped identify locations requiring targeted verification while limiting disruption to production.
The consolidated review comprised 382 scans and 3,118 scan lines, with high-frequency and low-frequency data used together. Of these, 552 scan segments were prioritised for further review. These are priority segments, not confirmed defects or voids.

Main findings
The review identified pipe-like responses near mapped wastewater corridors, changes potentially influenced by moisture, and repeatable variations near the slab–subbase interface at indicative depths of approximately 0.18–0.35 m. These findings provide a basis for targeted checks; GPR alone does not establish active leakage, pipe condition or air-filled voids.
Technical basis: consolidated GPR engineering review Rev P3, 17 October 2026, and the project URS compliance matrix dated 8 October 2026. This case study incorporates the confirmed scan records, line count and acquisition depth range.
Survey requirements and method
The User Requirement Specification (URS) called for a non-destructive assessment of the underground drainage system, comparison with available as-built drawings, classification of anomalies and practical follow-up recommendations in an operating industrial facility.
- Locate pipeline responses, assess alignment and indicative depth, and compare them with the as-built layout.
- Assess responses potentially associated with voiding, leakage-related ground changes, settlement, blockage or deterioration, while stating the limits of interpretation.
- Survey wastewater pipelines within a 900 mm-wide corridor, and survey pit surfaces with an additional 300 mm around their perimeters.
- Acquire, process and interpret the data; prepare drawings, sections and an anomaly register, with CAD-compatible outputs.
Why GPR was used
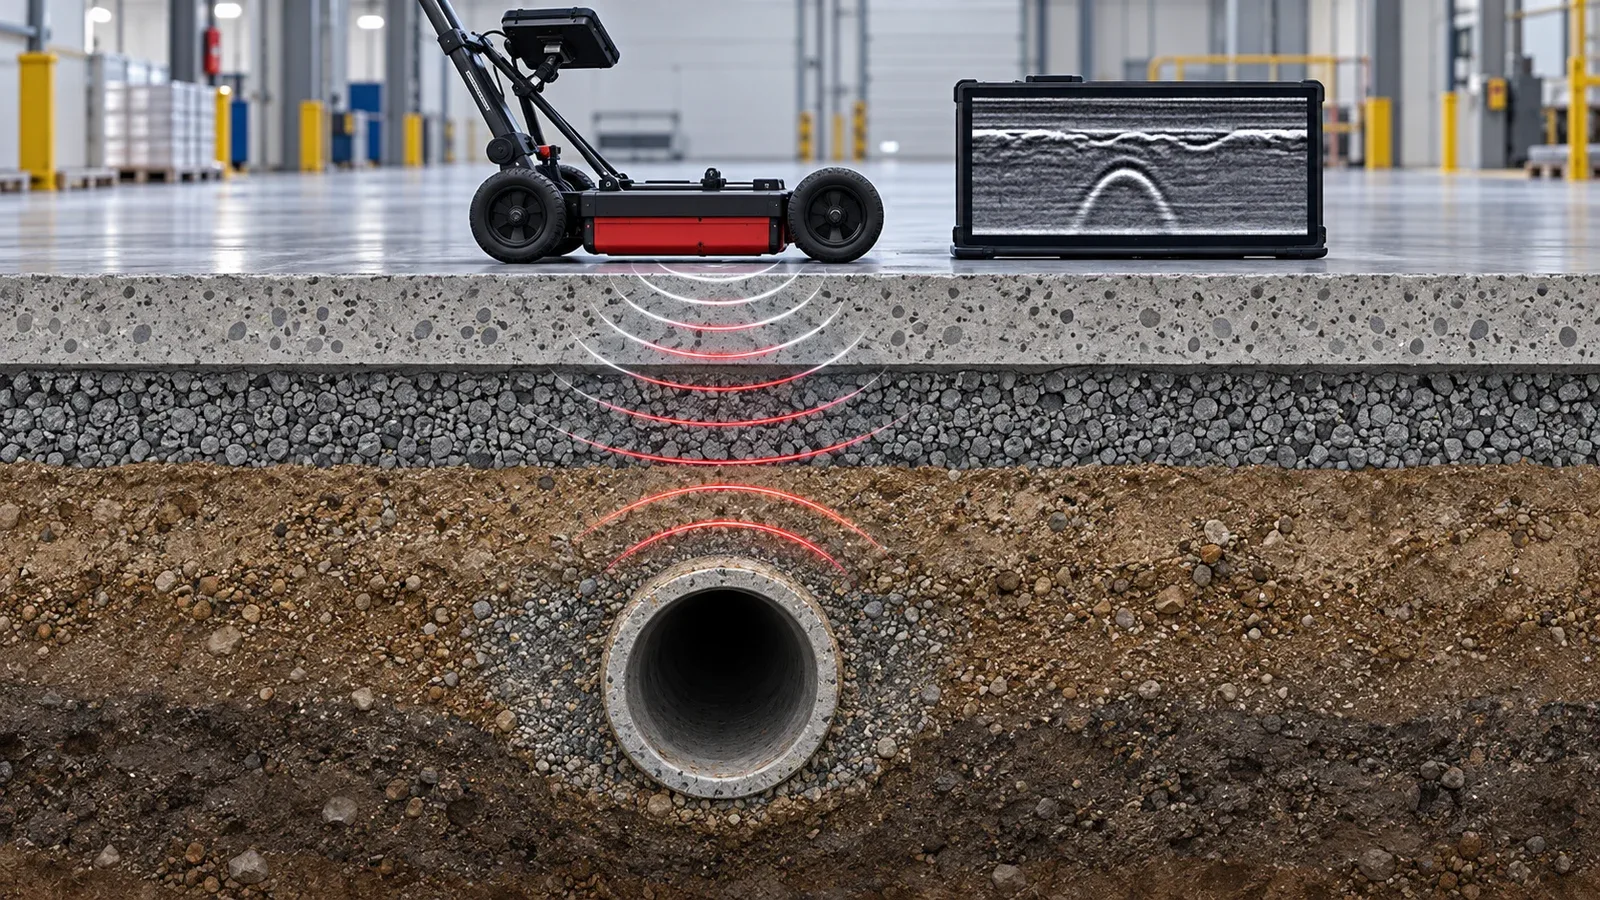
GPR allows closely spaced profiles to be collected across floor areas without coring or excavation. Comparing shallow and deeper responses helps identify departures from surrounding conditions and select locations for further investigation.
Reinforcement, slab joints, buried structures, previous repairs, variable fill, moisture, antenna coupling and loss of support can produce overlapping responses. Interpretation therefore considers repeatability and plausible alternative causes.
| Stage | Method and purpose |
|---|---|
| Inventory | Reconcile scan IDs, areas, HF/LF data and line counts; identify any gaps in coverage. |
| Processing | Apply moving-mean dewow with an approximately 6 ns window and time-dependent amplitude gain. Compare with a background-subtracted variant to test processing sensitivity. |
| Frequencies | Compare broader and deeper LF responses with shallow, higher-resolution HF responses. |
| Depth slices | Review nominal 10, 20 and 30 cm slices where appropriate to distinguish reinforcement, the slab interface and shallow subbase responses. |
| Context | Compare adjacent lines, spatial patterns, grid edges, drawings and site conditions. |
| Confidence | Separate confidence that a response exists from confidence in its physical cause. |
Survey coverage and records
The dataset covers five operational areas. The total of 3,118 refers to scan lines. High-frequency (HF) and low-frequency (LF) data were reviewed together. The 552 priority segments represent locations selected for technical review, not a count of confirmed defects.
| Area | Scans | Scan lines | Priority segments | Coverage |
|---|---|---|---|---|
| Area 1 | 259 | 700 | 205 | 248 line scans and 11 area scans |
| Area 2 | 43 | 556 | 49 | 35 area scans and 8 line scans |
| Area 3 | 26 | 661 | 66 | 26 area scans |
| Area 4 | 22 | 464 | 57 | 20 area scans and 2 line scans |
| Area 5 | 32 | 737 | 175 | Scan IDs 427–444 and 446–459 |
| Total | 382 | 3,118 | 552 | Five production areas |
The starting position and direction of every scan were accurately recorded. Scan dimensions were retained in the scan data. These records are complete and provide the information needed to reconstruct the scan layout and relate interpreted targets to the survey reference system.
The actual scan data covered the 3–5 m depth range. The ability to resolve a particular feature at depth still depends on reinforcement, moisture, material properties and signal quality.
Slab and subbase response
Repeatable variations occurred at indicative depths of approximately 0.18–0.35 m in all five areas. Confidence that a variation exists is generally moderate to high. Confidence that it represents an air-filled void is low to moderate because construction details, disturbed fill, moisture, joints, buried structures, repairs, antenna coupling and grid-edge effects remain plausible explanations.
Moisture and pipeline responses
Some response changes are consistent with moisture influence, particularly near wet zones or drainage corridors. Active leakage and its source require corroboration through CCTV, leak testing, moisture measurements or controlled exposure.
Pipe-like responses occur near mapped wastewater corridors, with the top of the interpreted feature at indicative depths of about 0.5–1.2 m. This supports corridor-scale correlation, rather than exact confirmation of the pipe centreline, identity, material, diameter or condition.
Findings by area
| Area | Indicative pipe top depth | Moisture interpretation | Interface findings and priority IDs |
|---|---|---|---|
| Area 1 | 0.6–1.0 m | Influence varies; leakage and source unconfirmed. | 0.18–0.35 m; Scan IDs 331, 329 and 330. |
| Area 2 | 0.6–1.1 m | More evident near wet zones and corridors; leakage unconfirmed. | 0.18–0.35 m; Scan IDs 375, 373, 371 and 364. |
| Area 3 | 0.6–1.2 m | Local influence near the corridor; source unconfirmed. | 0.18–0.35 m; Scan IDs 398, 400, 402 and 396. |
| Area 4 | 0.5–1.0 m | Moisture influence plausible; source unconfirmed. | 0.18–0.35 m; Scan IDs 412, 413 and 410. |
| Area 5 | 0.6–1.0 m | Stronger near the corridor at response depths of 0.3–1.2 m. | 0.18–0.35 m; the earlier interpretation at 4.35 m in Scan ID 435 is not supported. |
Interpretation limits
- GPR provides indirect evidence. A similar response may have more than one physical cause.
- Reinforcement and floor construction can obscure or mimic shallow anomalies.
- Depth estimates depend on the adopted electromagnetic velocity and dielectric model.
- No void-volume calculation was performed. Priority areas do not define cavity boundaries, affected area or repair quantities.
- Access restrictions, antenna coupling and grid-edge effects can reduce confidence locally, even where scan records are complete.
Traceability
Significant findings should remain linked to their scan identifiers, lines, local-grid positions and area summaries. The complete starting-position, direction and dimension records support this traceability. CAD placement checks and any numerical tolerance verification should be documented separately from data completeness.
Targeted verification and follow-up
The review distinguishes the observed radar response from its possible cause. The next investigation should address the uncertainty relevant to each location before repair design is finalised.
| Observed pattern | Recommended verification |
|---|---|
| Pipe-like response near a corridor | Check CAD position and corridor offsets; inspect the pipe with CCTV where accessible. |
| Moisture-influenced response | Compare with moisture measurements and operating history; perform targeted leak testing. |
| Repeatable shallow variations | Use controlled coring, borescope inspection, probing or an agreed intrusive check to distinguish loss of contact, disturbed fill, washout and construction details. |
| Response near a grid edge | Repeat or extend profiles and confirm target placement before intrusive work. |
- Use the complete scan records to position the 20 priority local-grid targets on CAD and check their relationship to the wastewater corridors. Record transformation residuals and offsets where a coordinate transformation is used.
- Check target placement before physical verification. Extend or repeat profiles where edge effects or ambiguous responses warrant further investigation.
- Retain the depth-calibration record, including the adopted dielectric value, representative hyperbola radargram, location and operator. Include a known-depth check where available.
URS assessment and practical conclusions
| URS topic | Assessment and supporting record |
|---|---|
| Condition assessment | Completed for five areas, with a consolidated review. |
| Processing and interpretation | 3,118 scan lines reviewed using a documented baseline and comparison workflow. |
| As-built correlation | Pipe-like responses correlate with mapped corridors; exact pipe identity and condition require separate verification. |
| Anomaly prioritisation | 552 segments prioritised for review; these are not confirmed defects. |
| Position and ±100 mm requirement | Scan records are complete: starting positions, directions and dimensions are recorded. Completeness alone is not independent certification of the ±100 mm tolerance. |
| Depth and ±10% requirement | On-site hyperbola fitting supports depth calibration. Retain the calibration record; verified ±10% accuracy is not claimed without supporting validation results. |
| Depth range of 3–5 m | Actual scan data covered this range. Feature resolution remains dependent on local signal conditions. |
| Settlement modelling | A separate task requiring time-series monitoring and agreed model inputs. |
Lessons for industrial surveys
Plan survey references, local grids, CAD coordinates and calibration together. Complete acquisition records make survey results traceable; verification of a specified accuracy tolerance is a separate check.
Combine GPR with CCTV and leak testing to assess the drainage assets, and with controlled physical checks to resolve uncertain ground conditions. Prioritise repeatable, spatially consistent responses near critical assets, particularly where operational history or surface evidence supports further investigation.
The survey narrowed a complex subsurface investigation to specific targets and appropriate verification methods. Repair scope should follow confirmation of the relevant pipe or ground condition.
Technical references
Project URS compliance matrix, 8 October 2026; consolidated GPR engineering review covering five survey areas, Rev P3, 17 October 2026; associated area summaries, scan inventory, HF/LF statistics and CAD records.
This case study summarises the project findings. It does not replace the engineering report, drawings, anomaly register, raw data or site-specific engineering assessment.